


一款基于highcharts.js插件的员工业绩流水折线图数据图表代码,员工业绩流水情况折线图js代码。
js代码
<script src=\"js/highcharts.js\"></script>
<script>
var chart = Highcharts.chart(\'container\', {
title: {
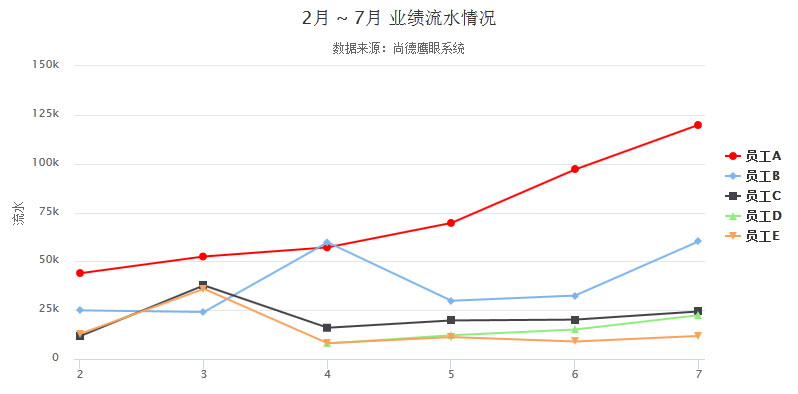
text: \'2月 ~ 7月 业绩流水情况\'
},
subtitle: {
text: \'数据来源:尚德鹰眼系统\'
},
yAxis: {
title: {
text: \'流水\'
}
},
legend: {
layout: \'vertical\',
align: \'right\',
verticalAlign: \'middle\'
},
plotOptions: {
series: {
label: {
connectorAllowed: false
},
pointStart: 2
}
},
series: [
{
name: \'员工A\',
data: [43934, 52503, 57177, 69658, 97031, 119931],
color:\"#ff0000\"
},
{
name: \'员工B\',
data: [24916, 24064, 59742, 29851, 32490, 60282]
},
{
name: \'员工C\',
data: [11744, 37722, 16005, 19771, 20185, 24377]
},
{
name: \'员工D\',
data: [null, null, 7988, 12169, 15112, 22452]
},
{
name: \'员工E\',
data: [12908, 35948, 8105, 11248, 8989, 11816]
}
],
responsive: {
rules: [{
condition: {
maxWidth: 500
},
chartOptions: {
legend: {
layout: \'horizontal\',
align: \'center\',
verticalAlign: \'bottom\'
}
}
}]
}
});
</script>


暂无评论内容