


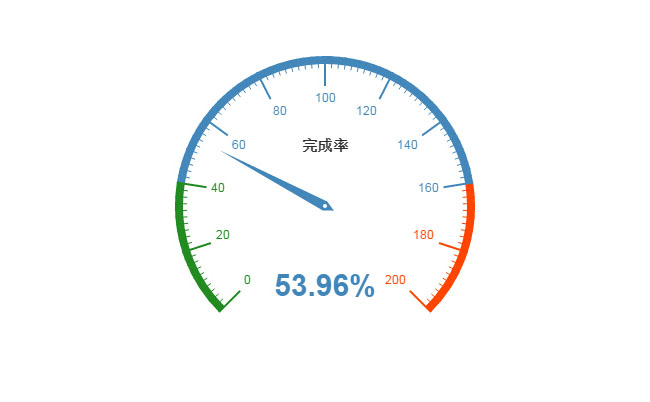
这是一款圆形的html5 echarts汽车加速仪表盘动画特效,模拟汽车加速减速时的仪表图表变化效果。
JS代码
<script type=\"text/javascript\">
    // 基于准备好的dom,初始化echarts图表
    var myChart = echarts.init(document.getElementById(\'main\'));

    var option = {
        tooltip : {
            formatter: \"{a} <br/>{b} : {c}%\"
        },
        toolbox: {
            show : true,
            feature : {
                mark : {show: true},
                restore : {show: true},
                saveAsImage : {show: true}
            }
        },
        series : [
            {
                name:\'业务指标\',
                type:\'gauge\',
				min:0,
				max:200,
                splitNumber: 10,       // 分割段数,默认为5
                axisLine: {            // 坐标轴线
                    lineStyle: {       // 属性lineStyle控制线条样式
                        color: [[0.2, \'#228b22\'],[0.8, \'#48b\'],[1, \'#ff4500\']],
                        width: 8
                    }
                },
                axisTick: {            // 坐标轴小标记
                    splitNumber: 10,   // 每份split细分多少段
                    length :12,        // 属性length控制线长
                    lineStyle: {       // 属性lineStyle控制线条样式
                        color: \'auto\'
                    }
                },
                axisLabel: {           // 坐标轴文本标签,详见axis.axisLabel
                    textStyle: {       // 其余属性默认使用全局文本样式,详见TEXTSTYLE
                        color: \'auto\'
                    }
                },
                splitLine: {           // 分隔线
                    show: true,        // 默认显示,属性show控制显示与否
                    length :30,         // 属性length控制线长
                    lineStyle: {       // 属性lineStyle(详见lineStyle)控制线条样式
                        color: \'auto\'
                    }
                },
                pointer : {
                    width : 5
                },
                title : {
                    show : true,
                    offsetCenter: [0, \'-40%\'],       // x, y,单位px
                    textStyle: {       // 其余属性默认使用全局文本样式,详见TEXTSTYLE
                        fontWeight: \'bolder\'
                    }
                },
                detail : {
                    formatter:\'{value}%\',
                    textStyle: {       // 其余属性默认使用全局文本样式,详见TEXTSTYLE
                        color: \'auto\',
                        fontWeight: \'bolder\'
                    }
                },
                data:[{value: 50, name: \'完成率\'}]
            }
        ]
    };

    // 为echarts对象加载数据
    myChart.setOption(option);

    setInterval(function (){
        option.series[0].data[0].value = (Math.random()*100).toFixed(2) - 0;
        myChart.setOption(option,true);
    },2000);
</script>


暂无评论内容