


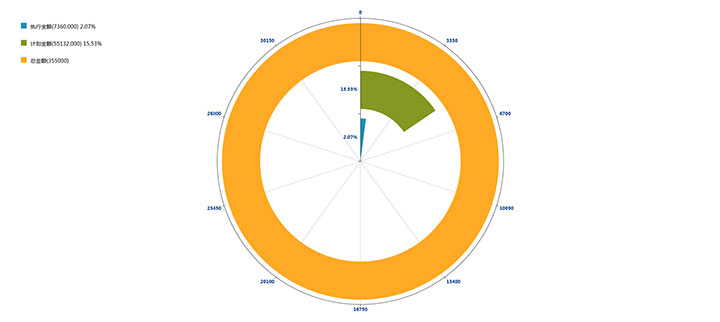
这是一款很不错的基于jQuery与echarts环状图表数据统计插件,百分比统计图表代码,环状图表环状的金额数据统计图表代码。
js代码
<script src=\"jquery-1.11.2.min.js\"></script>
<script src=\"echarts-3.6.js\"></script>
<script type=\"text/javascript\">
	$(function ()
	{
		$(\".legendShow\").css({\"top\":$(window).height()/5-100,\"left\":50});
		$(\"#div_pie\").height($(window).height());
		$(\"#div_pie\").width($(window).width());
		var chart = echarts.init(document.getElementById(\'div_pie\'), null, {
			renderer: \'canvas\'
		});
		chart.setOption({
			angleAxis: {
				axisLabel:
					{

						   formatter: function (value, index) { return value * 33500 / 100; }
					}
			},
			radiusAxis: {
				type: \'category\',
				data: [\"2.07%\", \"15.53%\", \"\"],
				z: 10
			},
			textStyle: {
				color: \"#104490\",
				fontSize: 16,
				fontStyle: 900
			},
			polar: {
			},
			series: [
				{
					type: \'bar\',
					itemStyle: {
						normal: {
							color: \'#1d94bc\'
						}
					},
					data:
						[
						{
							value: 100 * 736 / 35500
						},
						{
							value: 100 * 5513 / 35500,
							show: false,
							itemStyle: {
								normal: {
									color: \'rgb(134, 151, 34)\'
								}

							},
						},
						{
							value: 100,
							show: false,
							itemStyle: {
								normal: {
									color: \'#FFAA25\'
								}
							}
						}
						],
					coordinateSystem: \'polar\',
					name: \'总计划\',
					stack: \'a\'

				}],
			legend: {
				legend: {
					show: true,
					data: [\"总计划\"],
				}
			}
		});

	});

</script>


暂无评论内容