


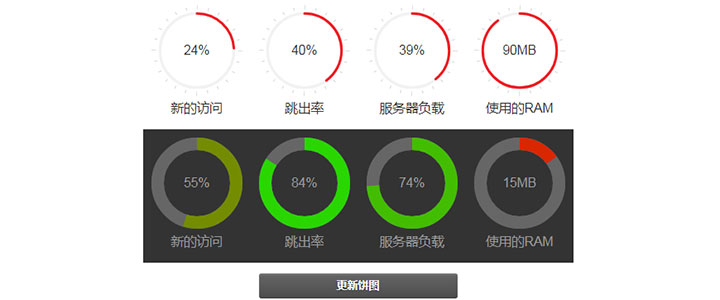
jQuery饼状图服务器资源图表统计代码,一款展示服务器新的访问,跳出率,负载等资源使用情况图表统计数据代码。
js代码
<script type=\"text/javascript\" src=\"js/excanvas.js\"></script>
<script type=\"text/javascript\" src=\"js/jquery.easy-pie-chart.js\"></script>
<script type=\"text/javascript\">
var initPieChart = function() {
	$(\'.percentage\').easyPieChart({
		animate: 1000
	});
	$(\'.percentage-light\').easyPieChart({
		barColor: function(percent) {
			percent /= 100;
			return \"rgb(\" + Math.round(255 * (1-percent)) + \", \" + Math.round(255 * percent) + \", 0)\";
		},
		trackColor: \'#666\',
		scaleColor: false,
		lineCap: \'butt\',
		lineWidth: 15,
		animate: 1000
	});

	$(\'.updateEasyPieChart\').on(\'click\', function(e) {
	  e.preventDefault();
	  $(\'.percentage, .percentage-light\').each(function() {
		var newValue = Math.round(100*Math.random());
		$(this).data(\'easyPieChart\').update(newValue);
		$(\'span\', this).text(newValue);
	  });
	});
};
</script>


暂无评论内容